Exploratory data analysis
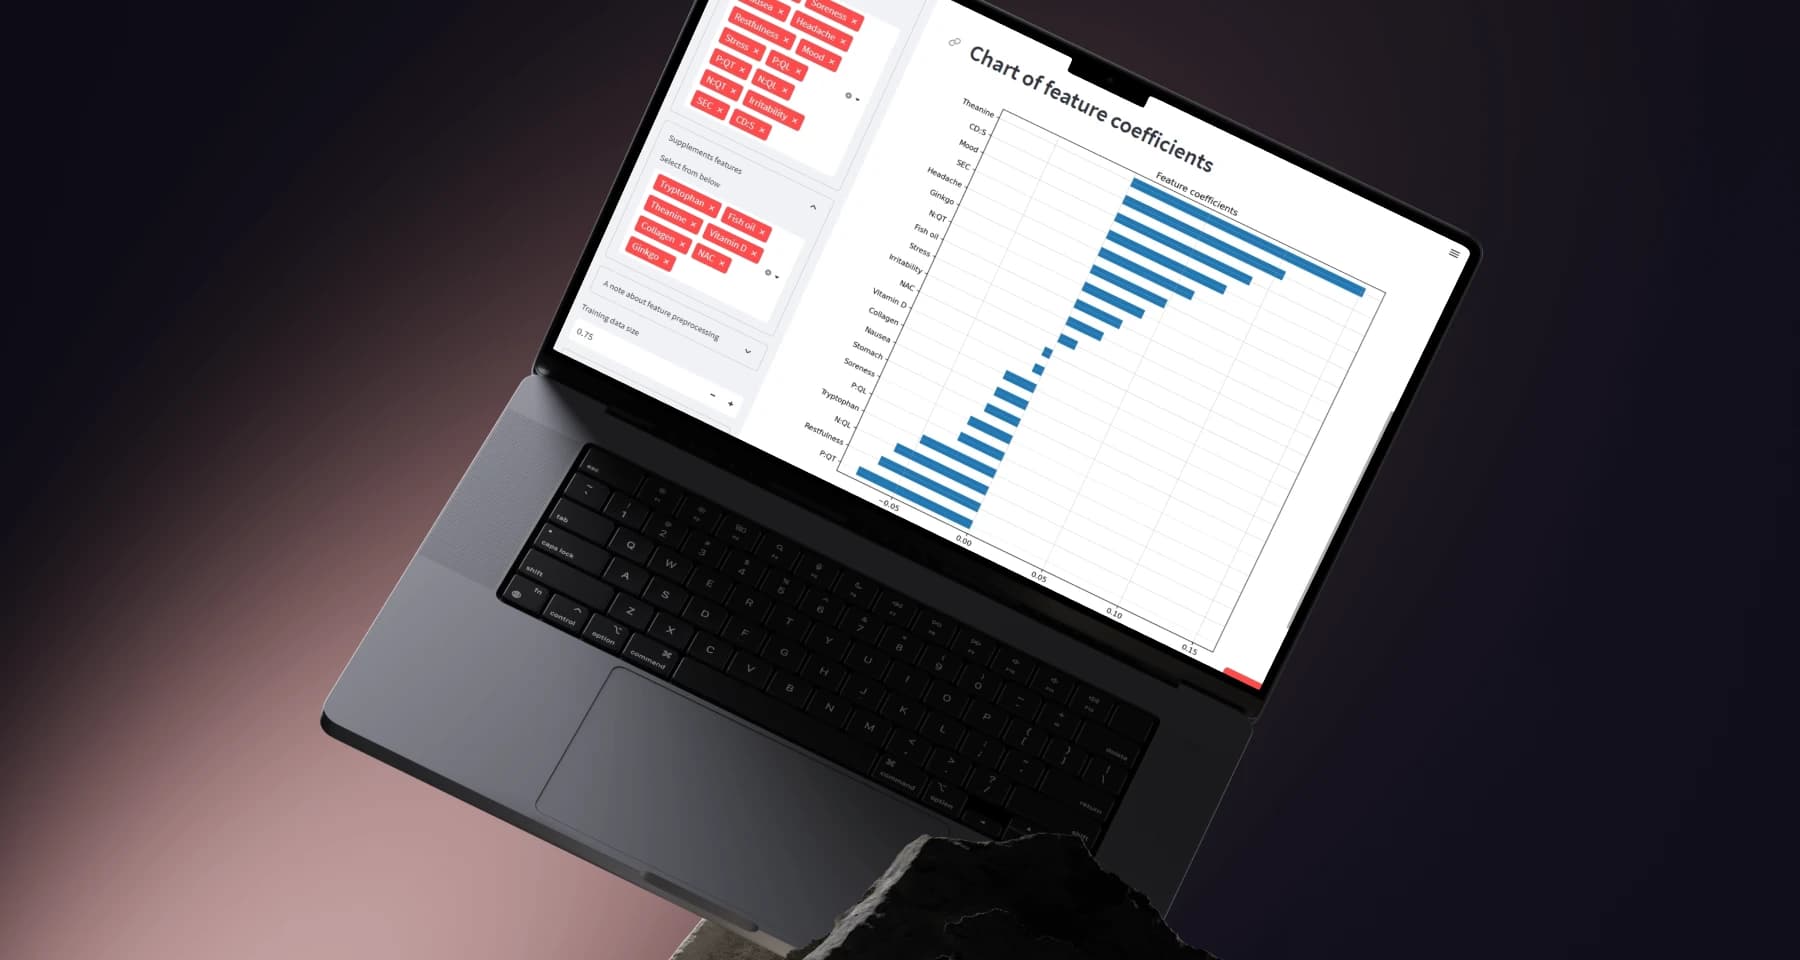
Interactive dashboard for exploratory analysis and visualization of +18,000 data points I collected about myselfAltair
Scikit-Learn
Matplotlib
Pandas
Numpy
Python
Streamlit
Overview
Challenges & solutions
Challenge
Some variables were continuous, others ordinal, a few were binary, and a bunch were quasi-quantitative (time quantity). The other challenge was normalizing and transforming the dataset in a way that is suitable for visualization across many variable types.
Solution
I used tools such as RapidMiner, Orange and countless others I can't remember to understand how automatic preprocessing that is optimized out of the box. From this, I extracted several patterns that I applied to my own dataset.
Scroll
GithubGitHub link


